TECHNOLOGY - ArcGIS
EAM 4023: Information Technology & Emergency Management (GIS)
GEOG 2833: Geographic Information Systems I - Introduction
GEOG 3403: Geographic Information Systems II – Planning
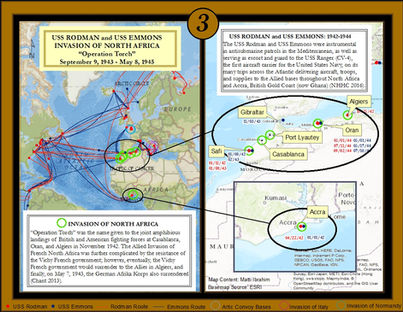
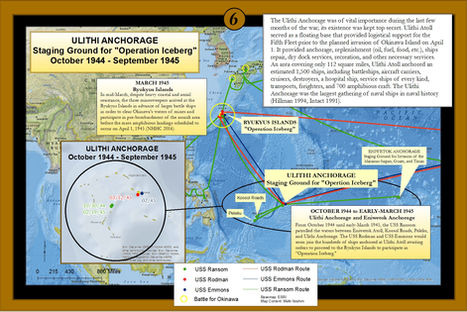
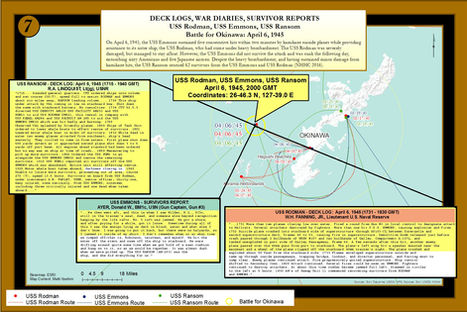
GEOG 4951: Research in Geography: “Operation Iceberg”
EAM 5993: Advanced GIS (Emergency Management)
FOOD INSECURITY AMONG SCHOOL-AGED
CHILDREN IN RUSSELLVILLE, ARKANSAS
ABSTRACT: The cycle of poverty and food insecurity are two main factors that negatively affect the health and well-being of millions of children. In the United States, one in six children are facing hunger and food insecurity every day (Feeding America, 2018a). In Arkansas, nearly 30% of all children live in poverty, and 61% live with food insecurity (Save the Children, n.d.). In Pope County, 21.6% of all children under the age of 18 live in poverty (U.S. Census Bureau, n.d.), and 23.5% of children live with food insecurity (Feeding America, 2018).
River Valley Food 4 Kids is the largest food pantry in Russellville and, because of this, they are able to reach out to many families in need. There are several programs in Russellville that assist families in need, but many families do not know where to go for help. The attached map listing available resources in Russellville (Appendix A) was created for River Valley Food 4 Kids. Kristen Foster expressed her gratitude for the map.


RASTER DATA SUITABILITY ANALYSIS
Assignment: You are asked by the State Government of Arkansas to find suitable locations to place a new type of astronomical imaging device. To avoid interference, the device must be located in a largely “open” area (so no developed land, few trees, no water, etc.), and it must be located more than 10 miles away from an existing cell phone tower (FCC data). Less-suitable locations can be located between 5 and 9.99 miles away from an existing cell phone tower (FCC data). Unsuitable locations are within 5 miles of a cell tower (FCC data). You are reminded that the potential locations must be in the state of Arkansas, so no parts of other states should be seen as “suitable”.


Scenario One: Plume
A large producer of book matches is located in Oleander, and the company stores quite a bit of flammable material on-site for match production. The fire chief wants to do a “tabletop” disaster drill in which a fire breaks out at the match plant. Movement of the plume and the building footprints are represented for the first hour, second hour, and third hour.
Scenario Two: Tornado
Data that change in location may also have a character or value associated with it that may also change. Through symbology, it is possible to map both the change in the physical location, as well as show how the associated attribute values change, such as the touchdowns of a tornado. The above map depicts both the change in location as well as the changes in the tornado’s strength and wind speed. Using the buffer tool, the affected buildings within the tornado buffer zone were able to be mapped.


Batch geocoding using United States Census Bureau North American Industry Classified System, Bing Maps Platform API, and the Excel Geocoder Tool
Assignment: Obtain and geocode addresses of all NGOs from NAICS, then make a map showing all NGOs located in Jonesboro, Arkansas.
Map utilizing Spider Diagram Scripts and Point Near Tool
Assignment: employ Point Near and the Create Spider Diagrams scripts to make a map showing the assignment of each fire call to its nearest response station.


Exercise in Digitizing and Editing. Instructions: Create a map of ATU campus, digitizing the named buildings on campus (bound by Arkansas, Phoenix, Glenwood). Export a map (pdf) of your digitized ATU campus with named buildings, with imagery as the base layer behind the buildings.
Exercise in Digitizing and Editing. Instructions: Create a 3D model of ATU’s campus. You will add a field showing the height of buildings each ATU building (‘FLOORS’ perhaps). Then, you will import this into ArcScene. In the layer properties tab, turn on “Extrusion” and extrude the layer to height (based on floors) to end up with a 3d model of campus. Third, your final 3d ArcScene campus model from the last question and convert the 3d model into a Google Earth “KML” file (use the Conversion toolbox).


